


Explanation of Perfusion Imaging and Its Importance
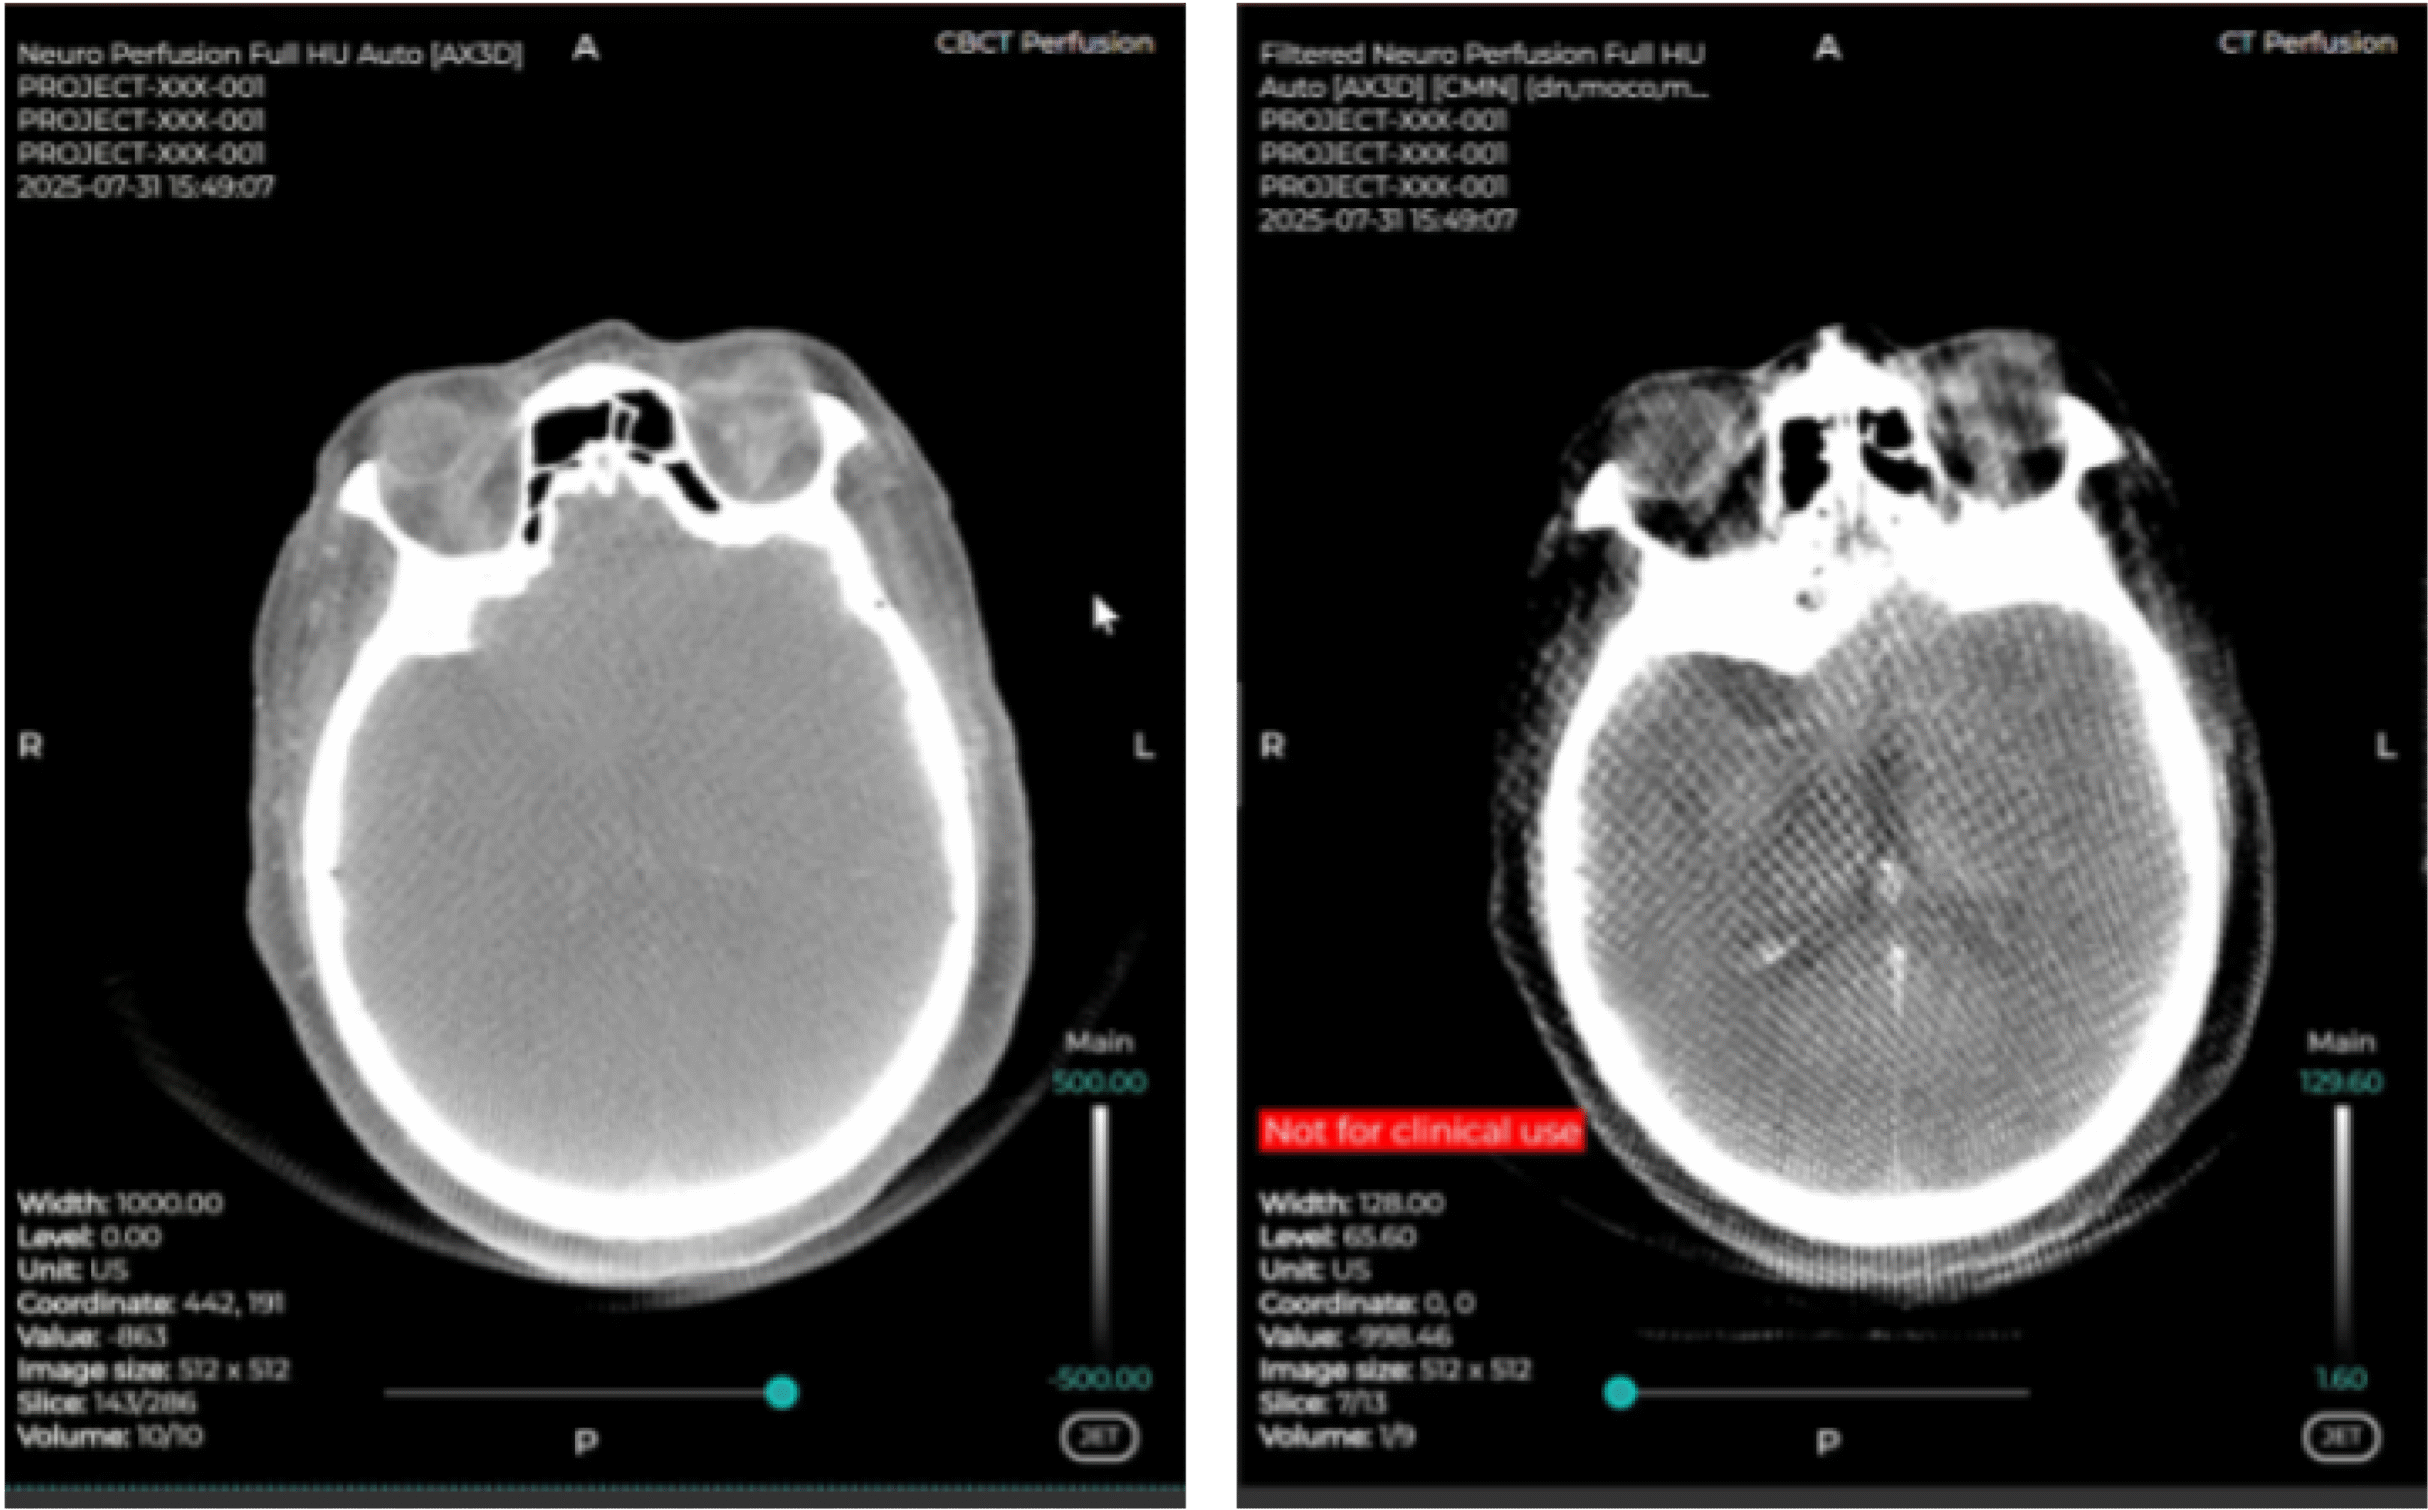
Perfusion imaging is a crucial technique in medical imaging that measures the flow of blood through the brain’s vascular network. It provides vital information about the delivery of oxygen and nutrients to brain tissue, which is essential for maintaining healthy brain function. By visualizing and quantifying blood flow, perfusion imaging helps in diagnosing and treating various neurological conditions, including stroke, brain tumors, and traumatic brain injuries.
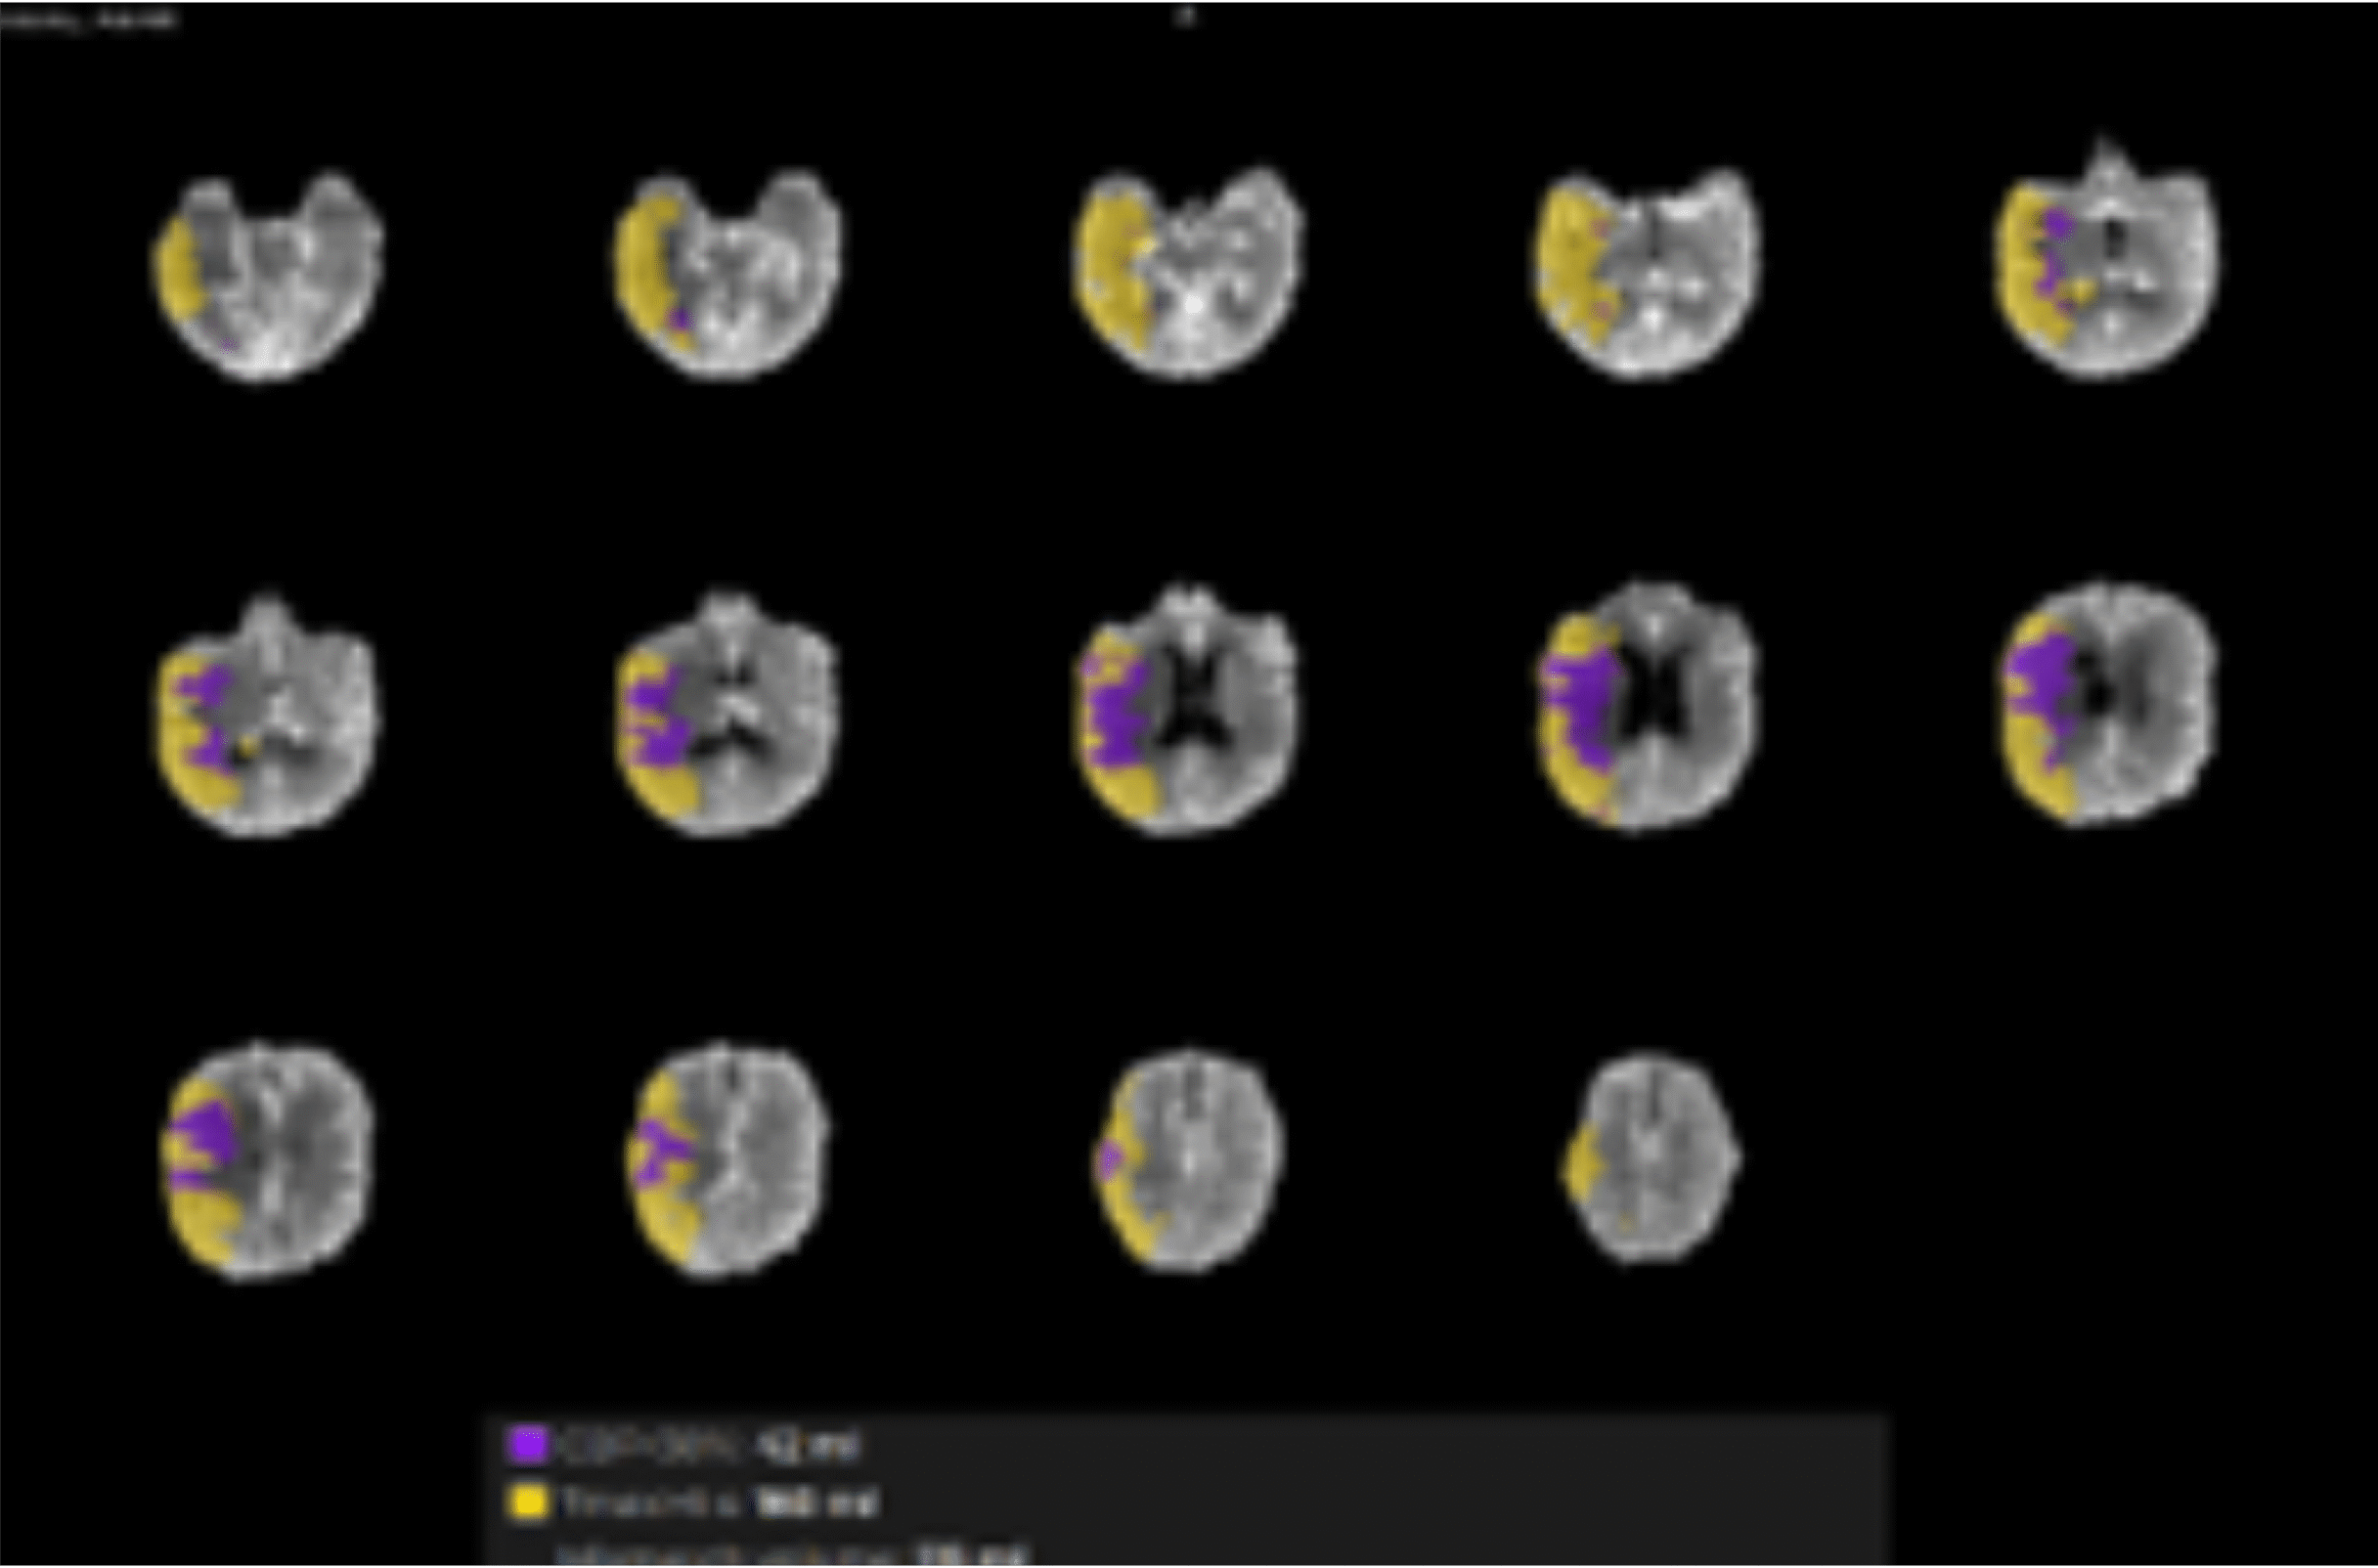
Perfusion imaging is particularly important in acute settings, such as during a stroke, where timely and accurate information about blood flow can significantly impact treatment decisions and outcomes. It helps clinicians identify areas of the brain that are at risk due to reduced blood flow (ischemia) and differentiate between regions that are permanently damaged and those that can potentially be saved with appropriate intervention.
Relative Cerebral Blood Flow (rCBF)
Relative Cerebral Blood Volume (rCBV)
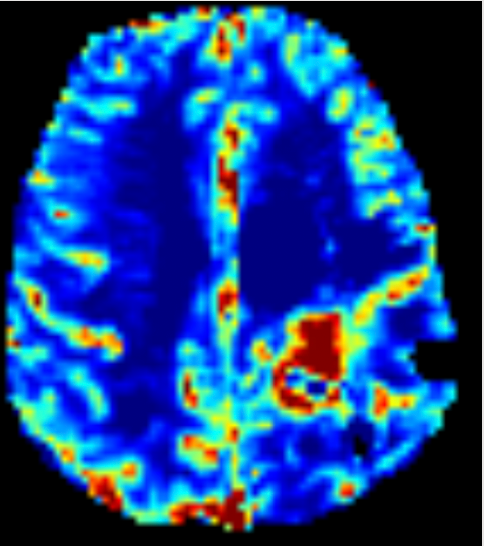
Mean Transit Time (MTT)
Time to Maximum (Tmax)
Capillary Transit-Time Heterogeneity (CTH)
Oxygen Extraction Fraction (OEF)
Cerebral Metabolic Rate of Oxygen (CMRO2)
Benefits of Microvascular Modeling in Diagnosis and Treatment Planning
Microvascular modeling offers significant advantages in the diagnosis and treatment planning of various neurological conditions. Here are some key benefits:
Enhanced Diagnostic Accuracy
Early Detection of Disease
Personalized Treatment Planning
Monitoring Treatment Efficacy
Improved Prognostication
Cercare Medical’s advanced microvascular modeling technology leverages these unique metrics to provide a comprehensive and detailed assessment of brain health. By going beyond traditional perfusion imaging, we empower clinicians with the tools needed to make more informed decisions, improve patient care, and ultimately enhance clinical outcomes

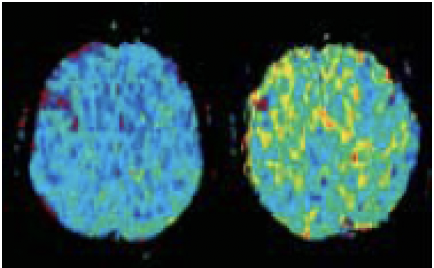
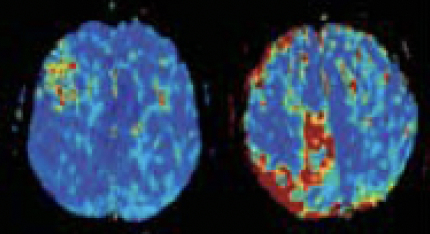
*Park et al., 2023 , ASAN Center, Seoul, South Korea
Prediction of pseudoprogression in post-treatment glioblastoma using dynamic susceptibility
contrast-derived oxygenation and microvascular transit time heterogeneity
measures - doi.org/10.1007/s00330-023-10324-9
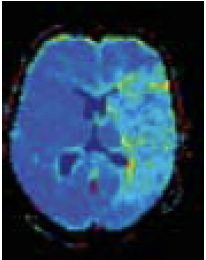

MTT

MTT

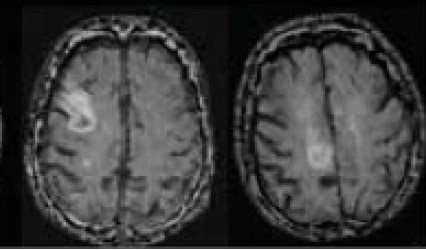
T2 FLAIR
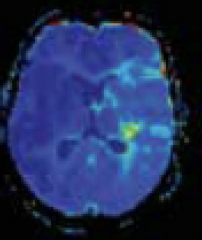
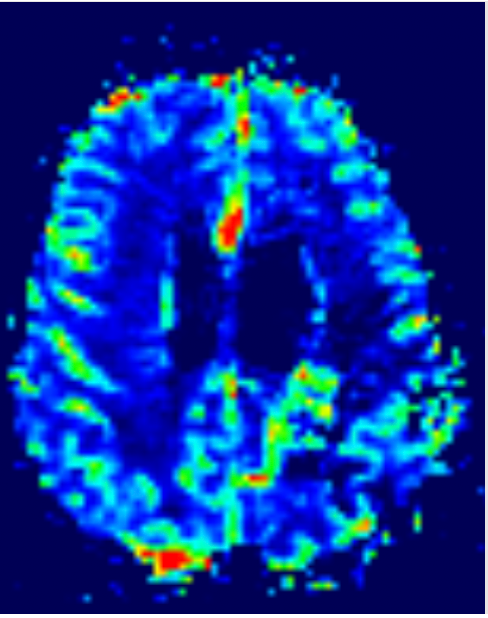
MTT

MTT
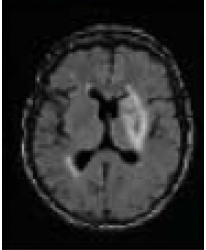
T2 FLAIR
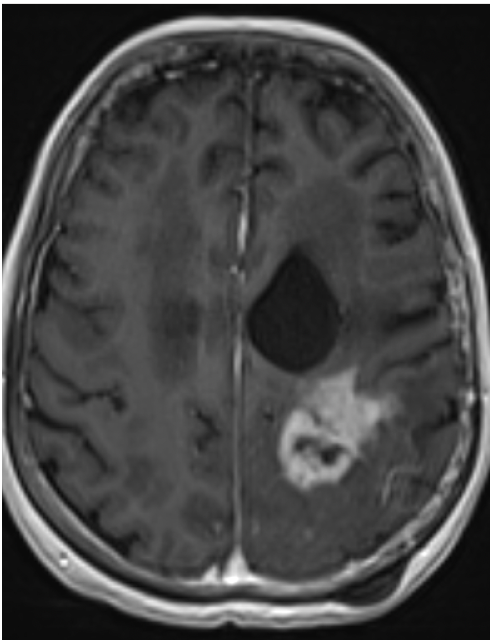
MRI
SVD METHOD
VASCULAR MODEL